The NIFTY 50 index is a well-diversified 50 companies index reflecting overall market conditions. NIFTY 50 Index is computed
using free float market capitalization method.
NIFTY 50 can be used for a variety of purposes such as benchmarking fund portfolios, launching of index funds, ETFs and structured
products.
Index Variants: NIFTY50 USD, NIFTY 50 Total Returns Index and NIFTY50 Dividend Points Index
Index Methodology
Eligibility Criteria for Selection of Constituent Stocks:
1. Market impact cost is the best measure of the liquidity of a stock. It accurately reflects the costs faced when actually trading an index. For a stock to qualify for possible inclusion into the NIFTY50, have traded at an average impact cost of 0.50% or less during the last six months for 90% of the observations, for the basket size of Rs. 100 Million.
2. The company should have a listing history of 6 months.
3. Companies that are allowed to trade in F&O segment are only eligible to be constituent of the index.
4. A company which comes out with an IPO will be eligible for inclusion in the index if it fulfils the normal eligibility criteria for the index for a 3 month period instead of a 6 month period.
Index Re-Balancing:
The index is re-balanced on a semi-annual basis. The cut-off date is January 31 and July 31 of each year, i.e. For a semi-annual review of indices, average data for six months ending the cut-off date is considered. Four weeks prior notice is given to market from the date of the change.
Index Governance:
A professional team manages all NSE indices. There is a three-tier governance structure comprising the Board of Directors of NSE
Indices Limited, the Index Advisory Committee (Equity) and the Index Maintenance Sub-Committee.
Facts as of 31st of May 2021
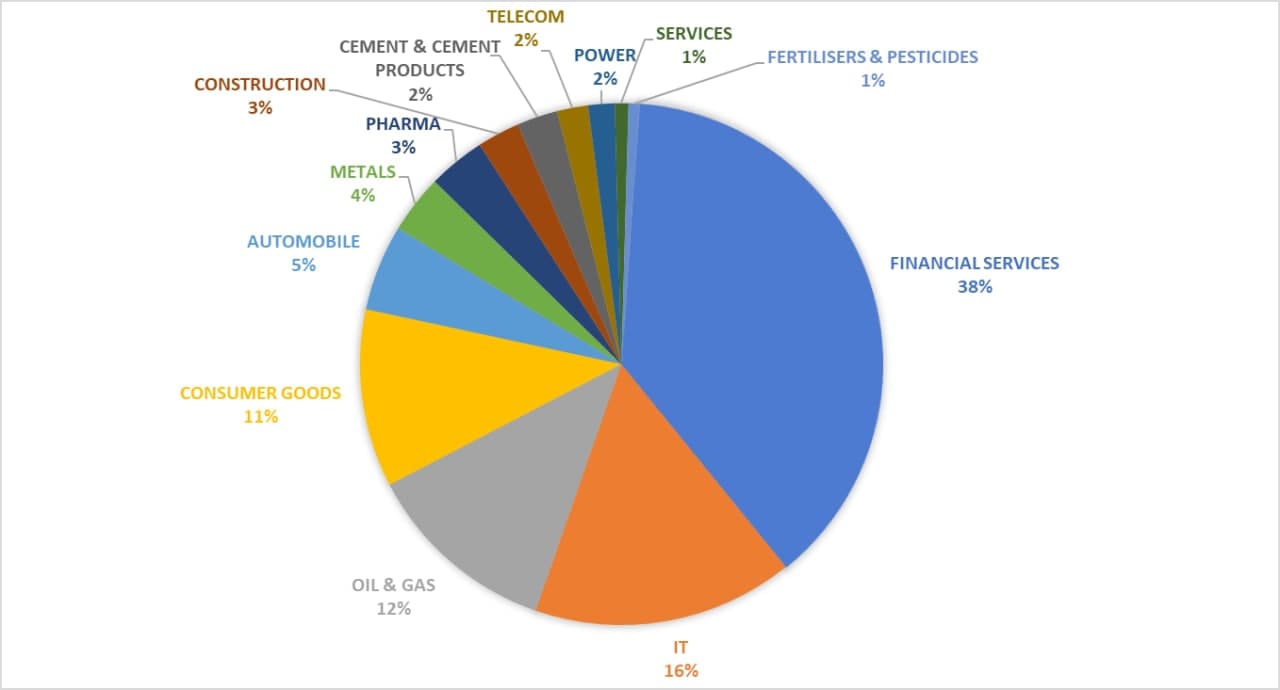
Her is the detailed breakdown of all the Nifty 50 companies. Sectoral weight-age has remained largely similar and the constituent companies have constantly changed.
1 : Financial Sector, Consumer Goods and IT Sector contribute 66% Weightage in Index.
2 : Financial Sector – 38.06% , Information Technology – 16.16%, Oil & Gas 12.04%.
| Sector | Weightage(%) |
| FINANCIAL SERVICES | 38.06 |
| IT | 16.16 |
| OIL & GAS | 12.04 |
| CONSUMER GOODS | 11.02 |
| AUTOMOBILE | 5.34 |
| METALS | 3.63 |
| PHARMA | 3.54 |
| CONSTRUCTION | 2.63 |
| CEMENT & CEMENT PRODUCTS | 2.53 |
| TELECOM | 1.92 |
| POWER | 1.64 |
| SERVICES | 0.84 |
| FERTILISERS & PESTICIDES | 0.67 |
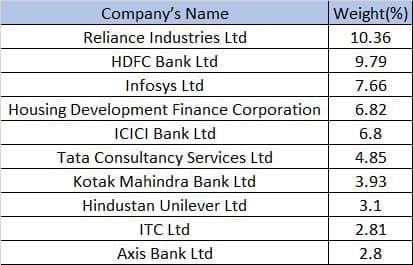
Top constituents by weightage company
Leave your comments in the comments section.


6 Comments. Leave new
Very nice article Sir, Thanks a lot for sharing the information.
A detailed view which will give anyone clarity on which company to invest with ..you can also use this data to predict where nifty is heading..
Thanks
Prabhu Sir
Nice information sir
Nice information sir. Will be useful to many
Good information
Excellent information i never seen this kind of information anywhere